Finally we are getting back to the topic of visualisation of data, eh? Haha! Let me do a short run through of the progression thus far. Over the past 2 weeks, we had chance to look at one of the data visualisation competition data and attempted to analyse the data as practice. I shall say that the practice gave us good opportunity to apply the materials learnt in lesson to help us do data filtering and processing. Just this week, the template data for the competition is finally released by Alibaba for the competing team to warm up for the actual data.
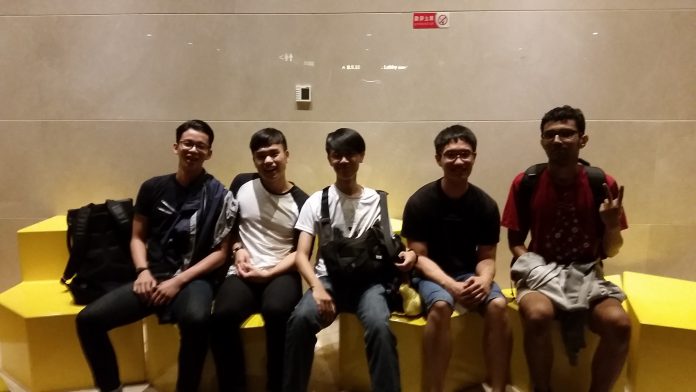
Our group consists of 10 members, splits into 3 sub groups. Our internal task is to conceptualise a data visualisation with the provided data and online materials if required. After the conceptualisation process, we will present our ideas to our leading professor for his approval then we will proceed with the competition.
Well, life is not all about work! So we decided to watch X-men before we start on work!


