


")


In this week, we continued working on the research project and on Wednesday, the data visualization summer class started. There are quite a few large changes made to the research project this week and the data visualization summer class is interesting as well.
On Monday, there is the weekly Design Fiction class. This is the last week of Design Fiction and also the start of our final project. The class this week talked about what makes a good video. The professor showed us multiple videos and gave quite a few pointers on what makes a good video. Some of the main points he talked about are that a good video would usually contain a good story, the way it is taken is focused on scenes that touches on our emotions and that the background audio effects are used appropriately to provide coherence to the entire video. The class then proceeded onto a short discussion on how we are going to do the final project. The requirements of the final project is to create a short 3min video on the topic of “future robots”. We are also required to include our origami robots that we made in the previous course. We are also expected to include animations within this short clip. For my group, we consist of me, Chia Yik and Martin, we decided to make a commercial trying to promote our origami robots and their capabilities as a form of “future robots”. There will be a set of smart robots that is able to take care of our homes as well as provide entertainment/conversation with the user. Our set consists of a penguin, a butterfly, a seal, a shark and a clam. These animal robots would be voice controlled and are capable of taking care of different parts of your home. For example, the penguin is in control of the house aircon, the butterfly can water your plants as well as maintain the humidity and sunlight to provide the best growing conditions for your flowers. The main problems we identified is that it might be hard to combine the origami robots together with another clip of us giving a promotion on the robot itself. That would be the focus this week where we try and remove the background of the existing clips of our origami robots.

Subsequently, we met up with Professor Sun to discuss about our research project and also to show him what we have done this week. Previously, we decided to work on video abstracting live stream gaming videos. However, when we presented to Professor Sun, he was quite against the idea as the significance of Twitch platform, gaming live streams pale in comparison to Taobao’s product advertising live streams where a much higher revenue is involved with Taobao’s live stream. Thus, he recommends us to focus on Alibaba’s need where they are looking for more short videos to provide consumers with a better understanding of the product. He recommends us to come up with a detailed plan on how to perform video abstraction on Taobao’s product advertising live streams. Following which, we discussed amongst ourselves and decided to switch over to product advertising live streams. The main issue we have with this switch is that none of us watches such advertising live streams and cannot visualize what an ideal abstracted video looks like. We then focused on watching some of these videos and try to come up with our own plan on how to perform video abstraction.
The following few weeks, we watched many such live streams, discussed on how exactly we are going to perform identification and defined what an ideal abstracted video means. We also discussed extensively with our teaching assistant on our deliverables as well as whether our flow of ideas makes sense. We decided on a general flow where assuming Alibaba has a compilation of all the live streams taken, we take in all these live stream videos and also the details of what the streamer is selling as well as the timings of which the buyer buys these products. Then we perform a series of classification and filtering such that we reduce the size of the input. Subsequently, we then perform various identification depending on the category. For example, if the live stream video is promoting food related products, it is likely the viewer will be interested in how the food came about, the process in obtaining and packaging the food as well as the method of delivery. All these would be the main highlights of our abstracted video. We then combine all such clips together to form a complete abstracted video where Alibaba can use it by attaching these videos onto the product description page in Taobao. This would likely increase sales of Taobao as information is more easily taken in in the form of a video and buyers would be more convinced to buy such products when information of its origin is clearly given.
On Wednesday onwards, the data visualization class also started. The entire class is given in Chinese and in the midst of listening, I am unable to comprehend much of the meanings of the words spoken. As the professors and Teaching Assistants use a lot of niched Chinese words which I don’t usually come into contact with. However, I am able to understand much of the slides as well as the examples given. Wednesday is an introduction to Data Visualization, Thursday is an introduction on the visual effects that we could create as well as what we should not have. The lecturer also briefly talked about the colours to use to give clarity. Following which, Friday is an introduction on the different basic techniques used in data visualization (E.g. bar graph, scatter plots, etc.) and Saturday is on Interactions and Animations within Data Visualization (E.g. the different types of interactions that could be made possible in Data Visualization). Last but not least, on Sunday, they covered the visualization regarding trees and graphs.
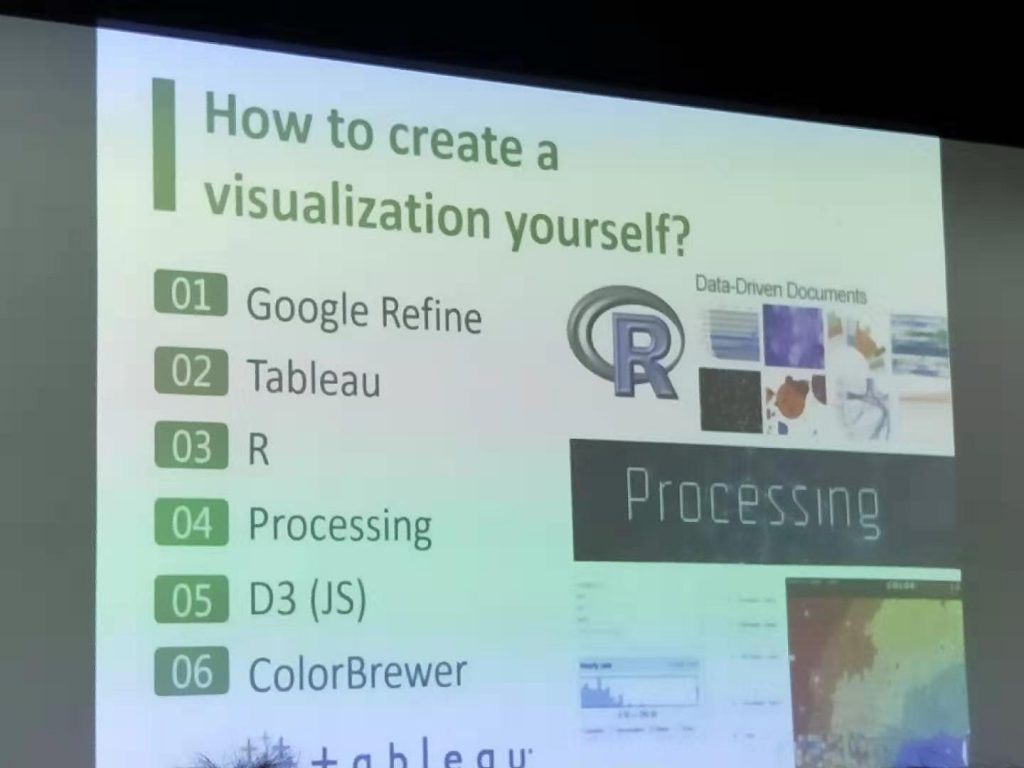
Throughout this entire course I believe we will be trying to learn HTML, CSS and Javascript together with some of the more niched packages such as D3 and React. For data manipulation and pre-processing, they encourage us to use Python while for drawing Graphs (the one with the nodes and edges) they encourage us to download Scipy and Networkx to draw. The course was pretty intense as everyday there was a lot of work to be done and a lot to be learnt. Just in the first day, they crammed the basics of HTML, CSS and Javascript altogether. And the final goal is to aim to recreate a visualization talked about in the paper “Reducing Snapshots to Points A Visual Analytics Approach to Dynamic Network Exploration”. The entire project is complicated but everything can be broken down into simpler parts. I will not be completing this project as half-way through I will be going for the pottery cultural program. However, after reading the paper I felt that the visualization method talked about within the paper is very insightful. I believe I will be attempting to recreate it on my own time after I improve my proficiency in D3 and React back in Singapore.
Although this week was tiring as I had to manage the Design Fiction project together with the Theme project as well as going for the Data visualization summer school, it was satisfying to be able to learn so much in such a short amount of time. It was a good week, looking forward to the next week where I will be going for pottery class as well!


