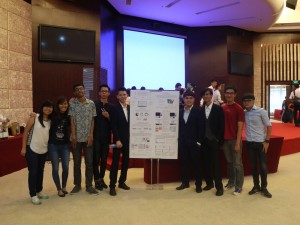
29/7/16 was a great day to be celebrated by all of the alp students. We shared what we had did all along the pass three months. Although we did not have a solid prototype, we presented video to introduce data visualization and how we visualize data. The buffet after the presentation was also quite impressive.

We were also lucky enough to be able to join a data visualization summer class that allowed us to learn more about data visualization and to have a chance to interact with others that were experience in this field. Week 12 was really an amazing week we had during our alp journey.

Click to rate this post!
[Total: 0 Average: 0]
Previous articleWEEK 8 – The Final “Yuquan Day”
Next articleMusic Emotion – WEEK 4
Team members: Aditya Raju / Basil Yap Ji Tsing / Debbie Lim Li Lin / Kan Yan Zhe / Lee Jing Rui, Marvin / Lee Quan Feng / Ong Wen Jun, Dominic / Sim Yan Jie / Tan Kwan Fu / Vanessa Tan Yun Han In this project of Visualization of Data, the team will receive environment data from China's department of Statistics to perform data analysis and to generate graphical representation of the data. In order to deliver the desired work, mathematical skills (statistics and data analysis) and graphics designing skills (photoshop and Illustrator) are crucial in presenting the environmental data in the simplest and most accurate manner. Programming skills such as Python, Javascript and C+ are part of the required skills of the project as the data has to be represented in an application.

LEAVE A REPLY

Please enter your comment!
Please enter your name here