


")


Project OMAR helps disaster contingency planners turn data into life-saving decisions
Project OMAR
Team members, from left to right: Jeremia Juanputra (ESD), See Yi Jie (ISTD), Khor Zile (ISTD), Lam Ying Sheng (ESD), Voon Soo Jun (ESD, not in photo), Nashita Abd Tipusultan Guntaguli (ISTD, not in photo)
Think your job is tough? Think again.
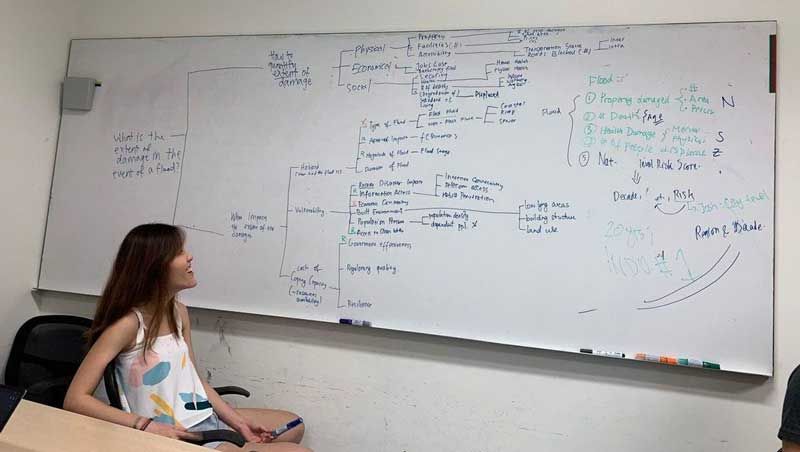
If your experience with natural disasters boils down to watching them on the television/cinema screens, good for you! While the obvious reaction in the face of an impending disaster is to move away from it as quickly as possible, contingency planners have the challenging task of facing the threat head on. Their task – gather all the data they can find, understand the full impact of the disaster, and develop a plan to save as many lives as they can.
“We spoke to quite a few professional planners in this field, and their experiences and stories were really useful to us,” Nashita begins. “For example, there was this contingency planner from the Red Cross, as well as a doctor from a disaster relief team. They told us that one of their challenges is to understand the impact of a disaster i.e. how much emergency supplies, such as rice and mattresses, do they need to prepare? When sending these provisions, they also have to consider if the access routes leading to these locations will be disrupted.”
If you think preparing for a disaster is tough, you’re absolutely right. But building a platform to help with the planning was no walk in the park either.
The focus on floods
“Our project task was to create a tool to better understand and plan for disasters,” Ying Sheng starts off. “Palantir, our industry partner, told us they wanted a platform that could take in data from different sources and aggregate it to produce accurate insights.”
 With Project OMAR, contingency planners can refer to historical data from specific regions to study trends.
“We went through literature reviews and interviewed planners about their pain points,” Zile chips in. “We also did a lot of readings and interviews, and that was when we decided to focus on disasters that had a lot of data for us to look at.”
The team knew that agencies are a rich source of data. For example, the National Environmental Agency has plenty of information on Singapore’s weather. “We went online to look at these agencies’ websites,” Yi Jie says. “We also explored big data sets, such as Kaggle, and open-source providers.”
Despite the large amount of material available, the team realised that they had to focus on one type of disaster in order to move on with their project – disasters as a whole are too diverse in their characteristics to tackle together. Palantir wanted to focus on the Asia-Pacific region, but the team refined this further by scoping it down to the ASEAN region – specifically, flood-prone Jarkata, Indonesia. As the capital of Indonesia, there was plenty of data for the team to study.
In Zile’s words: “When we settled on floods, we immediately knew what to look out for – information like terrain, weather, and rainfall.”
 Narrowing down the scope helped the team determine what data they needed to collect and visualise.
Armed with some preliminary data on floods, the team ran a quick visualisation to make sense of the information, adding features and improvements based on interviews with potential end-users.
“There were a lot of tests in between, and getting feedback,” Jeremia recalls. “We asked disaster planners what were the functions they required, and pared those down to the ones that would help them most. This helped us to refine our app, and the whole process was very much guided by the inputs of these end users.”
So, what help do disaster planners need to make contingency plans?
Turning data into life-saving decisions
“One of their greatest challenges is understanding the impact of a disaster,” says Soo Jun. “Let’s say they get a prediction that a typhoon will be coming in a few months’ time. They will have to do an impact assessment to decide, for example, how much rice and mattresses they’ll need to stock up, how are these resources going to reach the right locations at the right time, and if the access routes to these locations will be affected by the disasters.”
“Also, the planners are interested in the sensitivity of the data model,” Nashita elaborates. “They want to find causality, for example, how does the input data affect the output prediction, and how variables can influence the prediction’s accuracy.
Above: Soo Jun examines the various types of flood damage that the team listed
When the team interviewed potential end users to find out more about their day-to-day work, they were surprised to learn that many of them still use Excel sheets, or even pen and paper, to study data and understand trends. So the team also had to find a suitable data model that could transform disaster-related information into accurate forecasts.
“Finding the right model to use was a challenge for us,” Ying Sheng says. “When we first started out, we had limited knowledge about flood modeling and forecasting, which is an area of specialisation in itself. Also, different models require the data to be in different formats.”
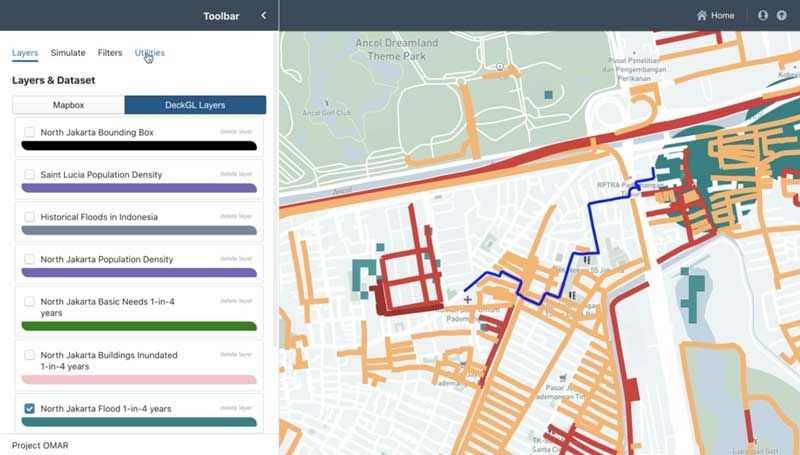 The roads in orange represent floods above 17 centimetres, and the roads in red represent flooding between 17 to 30 centimetres.
Fortunately, SUTD Associate Professor Stefano Galelli was able to set the team off in the right direction, having done numerous research in the fields of flood and water forecasting. In fact, he leads the Resilient Water Systems Group in the university.
“Prof Galelli advised us on the aspects and characteristics we should look out for,” Yi Jie recalls. “One of the data models we tried was the HEC-RAS. It’s used by the US Army Corp of Engineers, so it seemed like a good option. But the data needed to use this model wasn’t easy to find, so we switched to openLISEM, an open-sourced model developed by Dr Victor Jetten from the University of Twente in Netherlands. Dr Jetten has a lot of experience in disaster modeling. We were already experimenting with his model before we managed to interview him, and the session with him convinced us to use his model for our platform.”
 At first, it took days for the platform to process the data for visualisation, so the team had to come up with different processes to reduce the time taken.
A successful recipe for disaster (planning)
With such an open-ended project task of building an integrated disaster model, how did the team rise up to the challenge?
“Thankfully, we’ve done quite a few of such (open-ended) assignments before,” Zile laughs. “For ISTD (Information Systems Technology & Design) students, for example, we have an Elements of Software Construction module where we have to come up with a software/application from scratch. So this is quite similar, except that the Capstone project is done on a bigger scale.”
“SUTD’s design-focus curriculum really helped us with the project too,” Jeremia adds. “Because the problem statement was quite open-ended, we had to figure out what we wanted the platform to do. The design process we learnt enabled us to build the app by focusing on how we can help disaster planners do their work.”
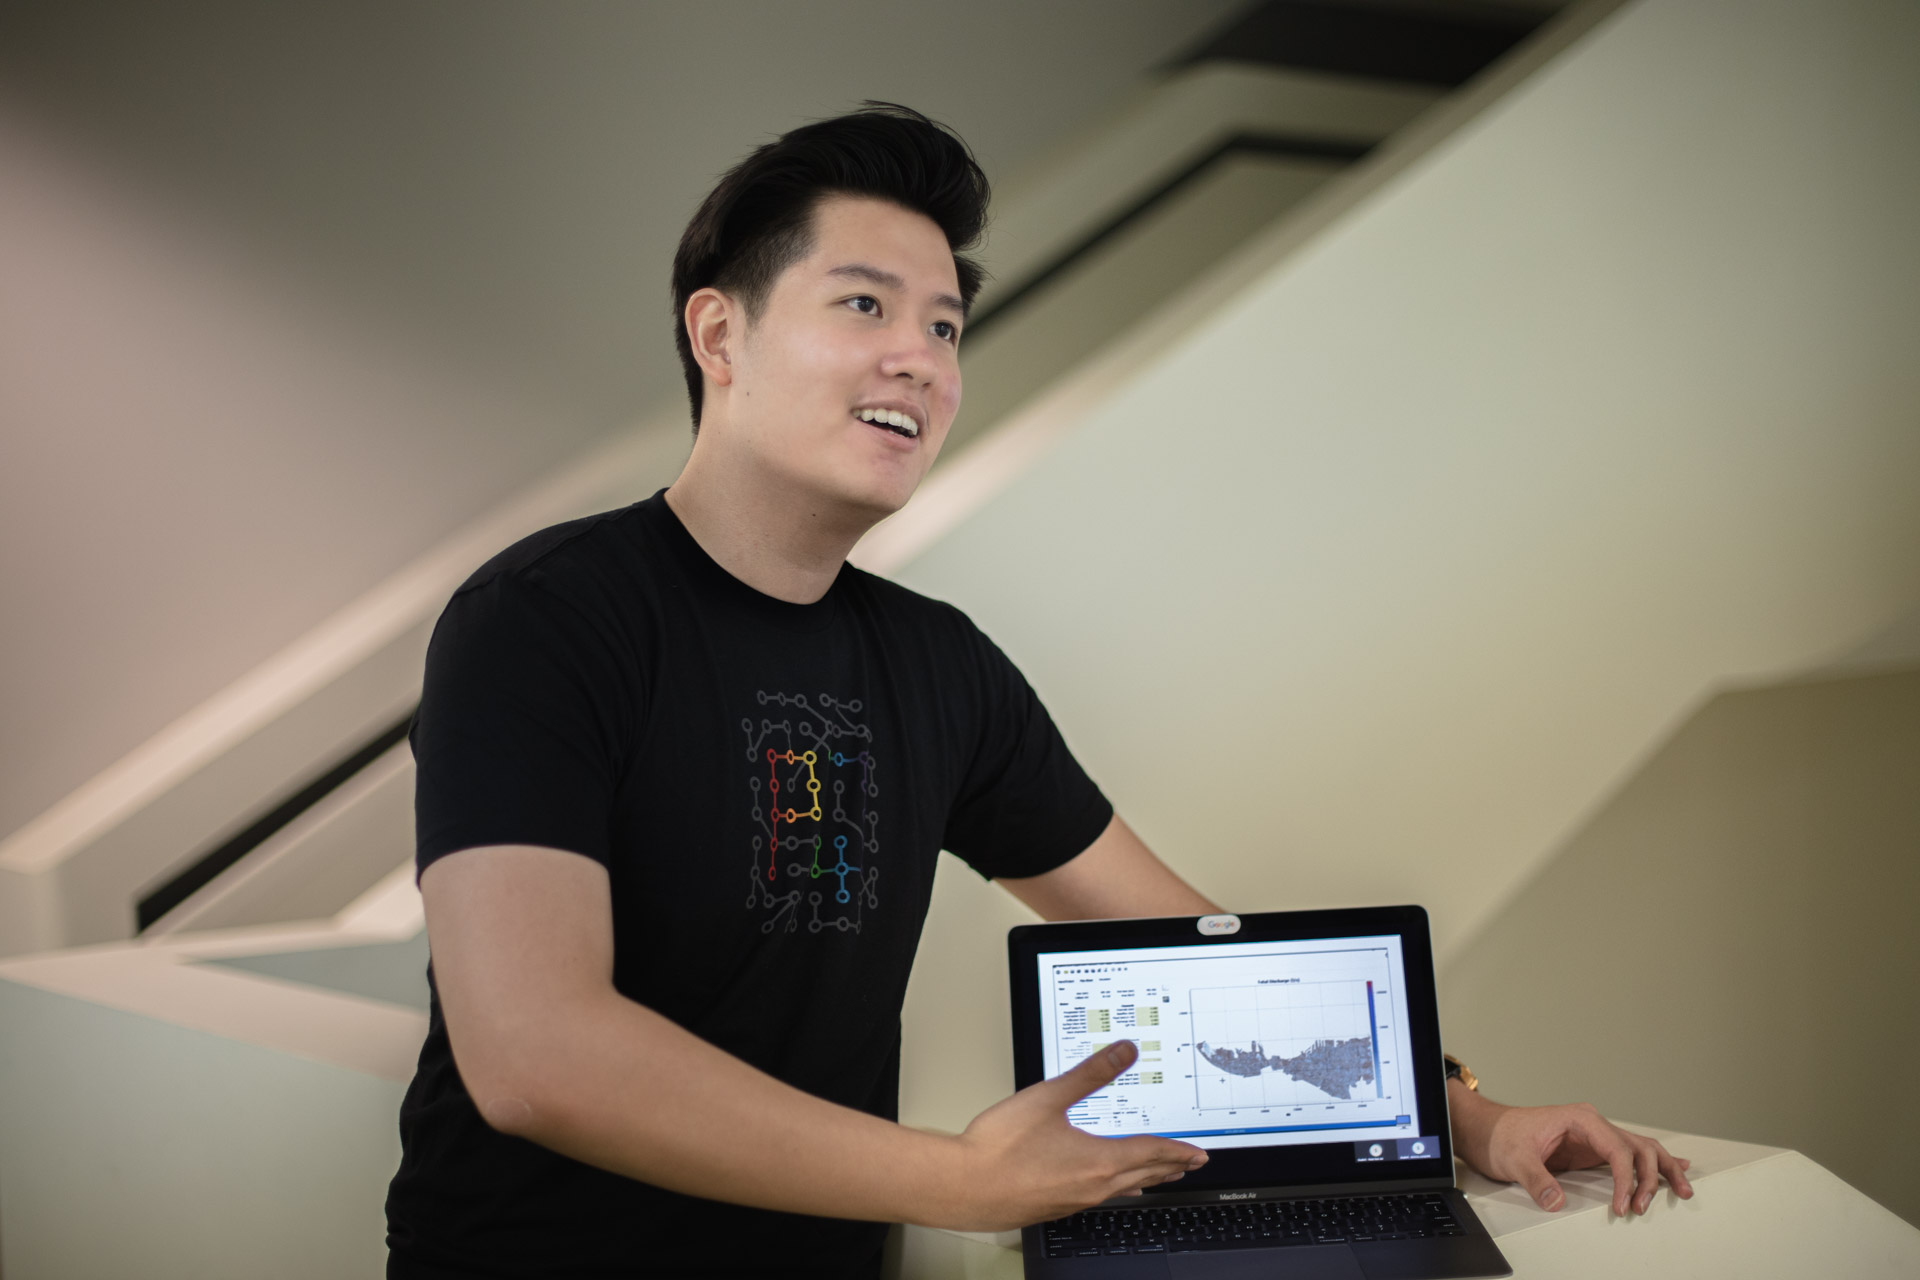 By feeding in data such as precipitation and geological maps, openLISEM can calculate maximum water height maps to help contingency planners assess flood impacts.
Although the team is made up of an even mix of ISTD and ESD (Engineering Systems and Design) students, Soo Jun explains that there were plenty of crossovers in their responsibilities.
“Actually, we were pretty much doing the same thing,” she says. “That was especially true in the initial phase where we were scoping the problem statement and processing the data. It was only at the later stages when we split into the ISTD team and ESD team when our responsibilities became more distinct; the ESD team members tackled the data model while the ISTD team members developed the platform. Even then, whatever work done on the data would influence the platform and vice versa, so we would give suggestions and pitch in whenever we could.”
The future of Project OMAR
The team is in talks with Palantir to expand the project, which could very well go beyond the scope of floods.
“For example, we can run simulations on regions outside of Jarkata,” Soo Jun explains. “For now, we’ve only explored floods caused by rains, but by adding other variables such as sea levels and setting the parameters accordingly, we can use the platform to study the impacts of coastal floods. Of course, more research is needed in order to collect the relevant data and get the parameters right, but the methodology is already built into the system.”

Like what you just read?
Check out the Project OMAR page on our Capstone Design Showcase 2020 website for more videos and information!
https://capstone2020.sutd.edu.sg/projects/project-omar
Missed our Open House talks? Rewatch the sessions here.
#whySUTD? We’re glad you asked – here’s why!
It can be hard to ask the right questions that will help you to decide which university to join, so we’ve compiled a list of FAQs for you here.


