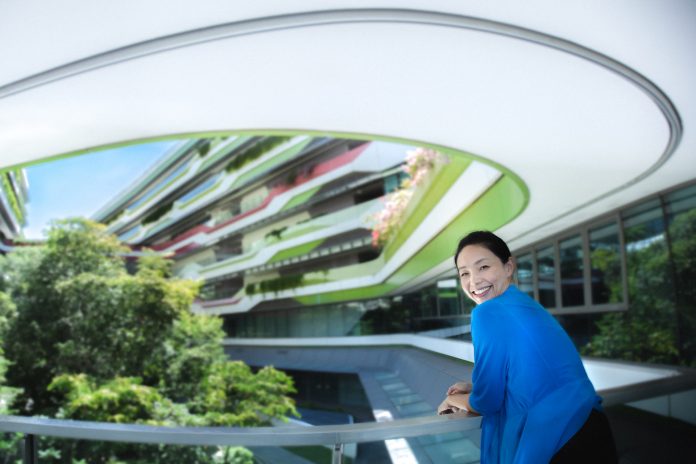
Our social media habits are helping researchers like third-year PhD student Chuang I-Ting get useful insights on the kind of urban environments we prefer, so that they can design more of them for us in the future.
Picture this: you’re strolling leisurely in the scenic Bishan-Ang Mo Kio Park. You snap a nice picture, pen a great caption, geotag the location, and off this tweet goes into the great Twitter feed.
Now let’s expand this story further. You don’t stay in Bishan or Ang Mo Kio. You’ve actually come all the way from your home in, let’s say, Sembawang, because there’s something here that you don’t find in parks near Sembawang. Maybe it’s the scenery, the facilities, or the design. You can’t put a finger to it; but you definitely like Bishan-Ang Mo Kio Park more.
If this sounds familiar to you, you’re not alone. According to I-Ting’s analysis (remember that tweet you sent out?), there’re many others like you who’ve come from far and wide across the island just to chill out in this beautiful park.
And she wants to know why.
Using big data to sense public spaces
Chuang I-Ting is an architect-turned-PhD-student from the Architecture and Sustainable Design (ASD) programme. In her research, she looks to using big data – tweets, specifically – to identify public spaces that are not only able to attract people, but also “different backgrounds of people” – or in architectural speak – she’s searching for places that have both density and diversity. These traits make a public space successful, and I-Ting wants to identify them so that she can look into their design qualities to get insights on what makes them popular, or not.
The problem with diversity
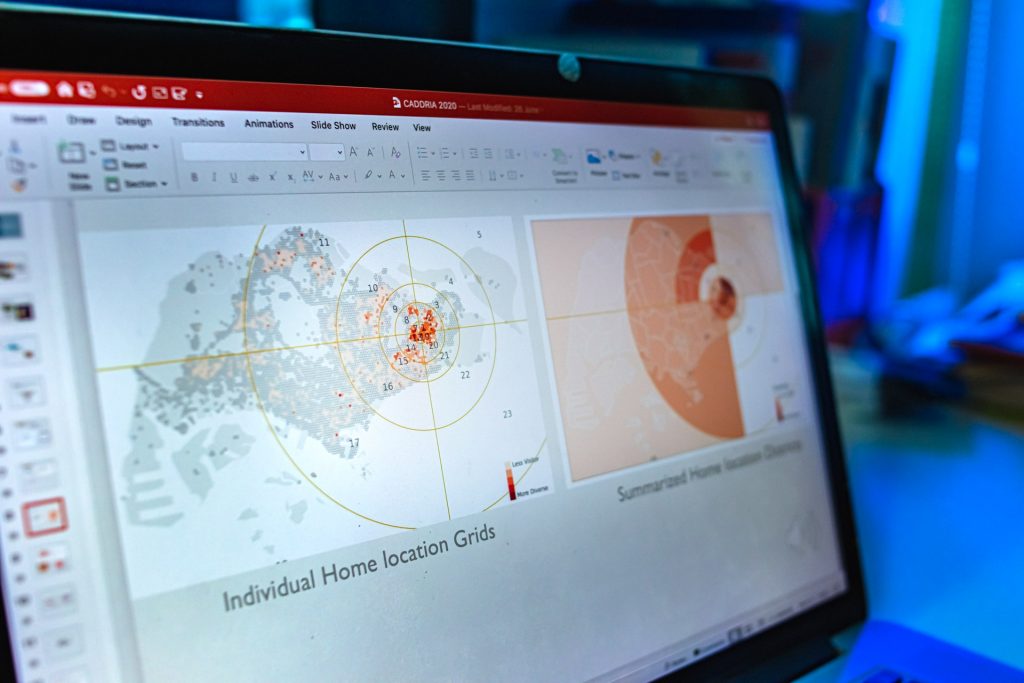
But it’s not that easy to measure these qualities. While density can be easily quantified by “summarising big data points and seeing the patterns,” diversity is not so straightforward. Till today, researchers are still relying on resource-heavy methods like onsite observations and surveys to collect data on diversity.
Luckily, I-Ting is about to change that. In fact, she’s one of the first to use social media data to study diversity in public spaces. “When we first started, we weren’t sure if the numbers would reflect the trends accurately,” she recalls. “It’s difficult to use big data in a simplified way. We need to be extra critical of what the data is actually representing”.
But fortune favours the bold.
A fitting collaboration with HASS
Having worked as an architect for many years before moving into academia, I-Ting understands the importance of combining theory and practice. “I think that should be the way. The traditional way of teaching doesn’t fit everyone; at least, it’s just not for me. Unlike other universities, SUTD’s curriculum is unique – they encourage and provide opportunities for interdisciplinary collaborations.” She describes her research experience here as being “free to come up with anything that we can imagine.”
She continues, “The faculty members are very supportive of our ideas. They support us with their own expertise and direct us to the right experts to advise on the research matter. They might say, ‘Maybe I cannot help you, but this person might.’ ”
And that’s how she got to collaborate with Ate Poorthuis, who was an Assistant Professor and data scientist from the Humanities, Arts and Social Sciences (HASS) cluster. “Ate not only offered his guidance, but he is metaphorically speaking a ‘server’,” I-Ting laughs. “A server who has over 22 million local tweets stored in his repository. He plays a really big part in this research. I won’t be able to do this without him, so I’m really thankful to him.”
What your tweets say about you
With Ate’s data power, I-Ting manages to find a simple way to quantify diversity. “It’s a lot of details, how we do it,” I-Ting sums up with a laugh. But nailing down the definition is an important progress in her research. For her research, diversity is defined as the “home location” of people – in simpler terms: where you live.
By I-Ting’s definition, a place is diverse when people from different home locations convene at that particular place. With this assumption in place, she can then focus on analysing the geolocations of tweets.
There’s something peculiar about Bishan-Ang Mo Kio Park
Those tweets that you and many others sent brings Bishan-Ang Mo Kio Park to I-Ting’s attention. According to her findings, as a neighbourhood park, it should have a low diversity count (since they’re built to serve people living in the area). The tweets, however, say otherwise; based on the data, the park counts as a low-density and high-diversity place.
“This is the category of space that we’re most interested in, and it’s also the most challenging to define by the traditional concept of analysis,” I-Ting explains. A place that falls into this classification, despite it being not a high-density place, attracts visitors who live outside the neighborhood. This is a clear indication that there must be certain attractive features or qualities that are drawing people there.
As a third-year postgraduate student, I-Ting’s research is approximately three-quarters done. She remarks that her success in quantifying diversity using big data remains the most exciting part of her work so far. “Most research approaches predominantly focus on density only because it’s easier to see the patterns,” she explains. “But density and diversity are the two key concepts in urban design and architecture design to promote inclusiveness. Diversity helps us find qualities that would help make public spaces vibrant and attract people.”
These qualities are what I-Ting is going to study in the next phase of her research. As countries develop and cities move towards sustainable communities, urban parks will become a key feature in these highly-urbanised areas. “I wanted to see how much we can do with the social media data to relate back to space. That’s how it all started.”
Thinking about applying to SUTD?
Find out more about our programmes and application process here.


