


")


Hi everyone!
We are from the Data Experience theme and have been working on our different prototypes after having spent the first 7 weeks on understanding how to effectively convey data through visualizations.
“Data Experience” could be described as a way of communicating data via involvement – to communicate data with more ‘human’ elements like the senses, not with emotionless numbers and figures; and to bring about a more personal understanding of data through emotions and senses.
Let me first bring you through our journey over this past 10 weeks!
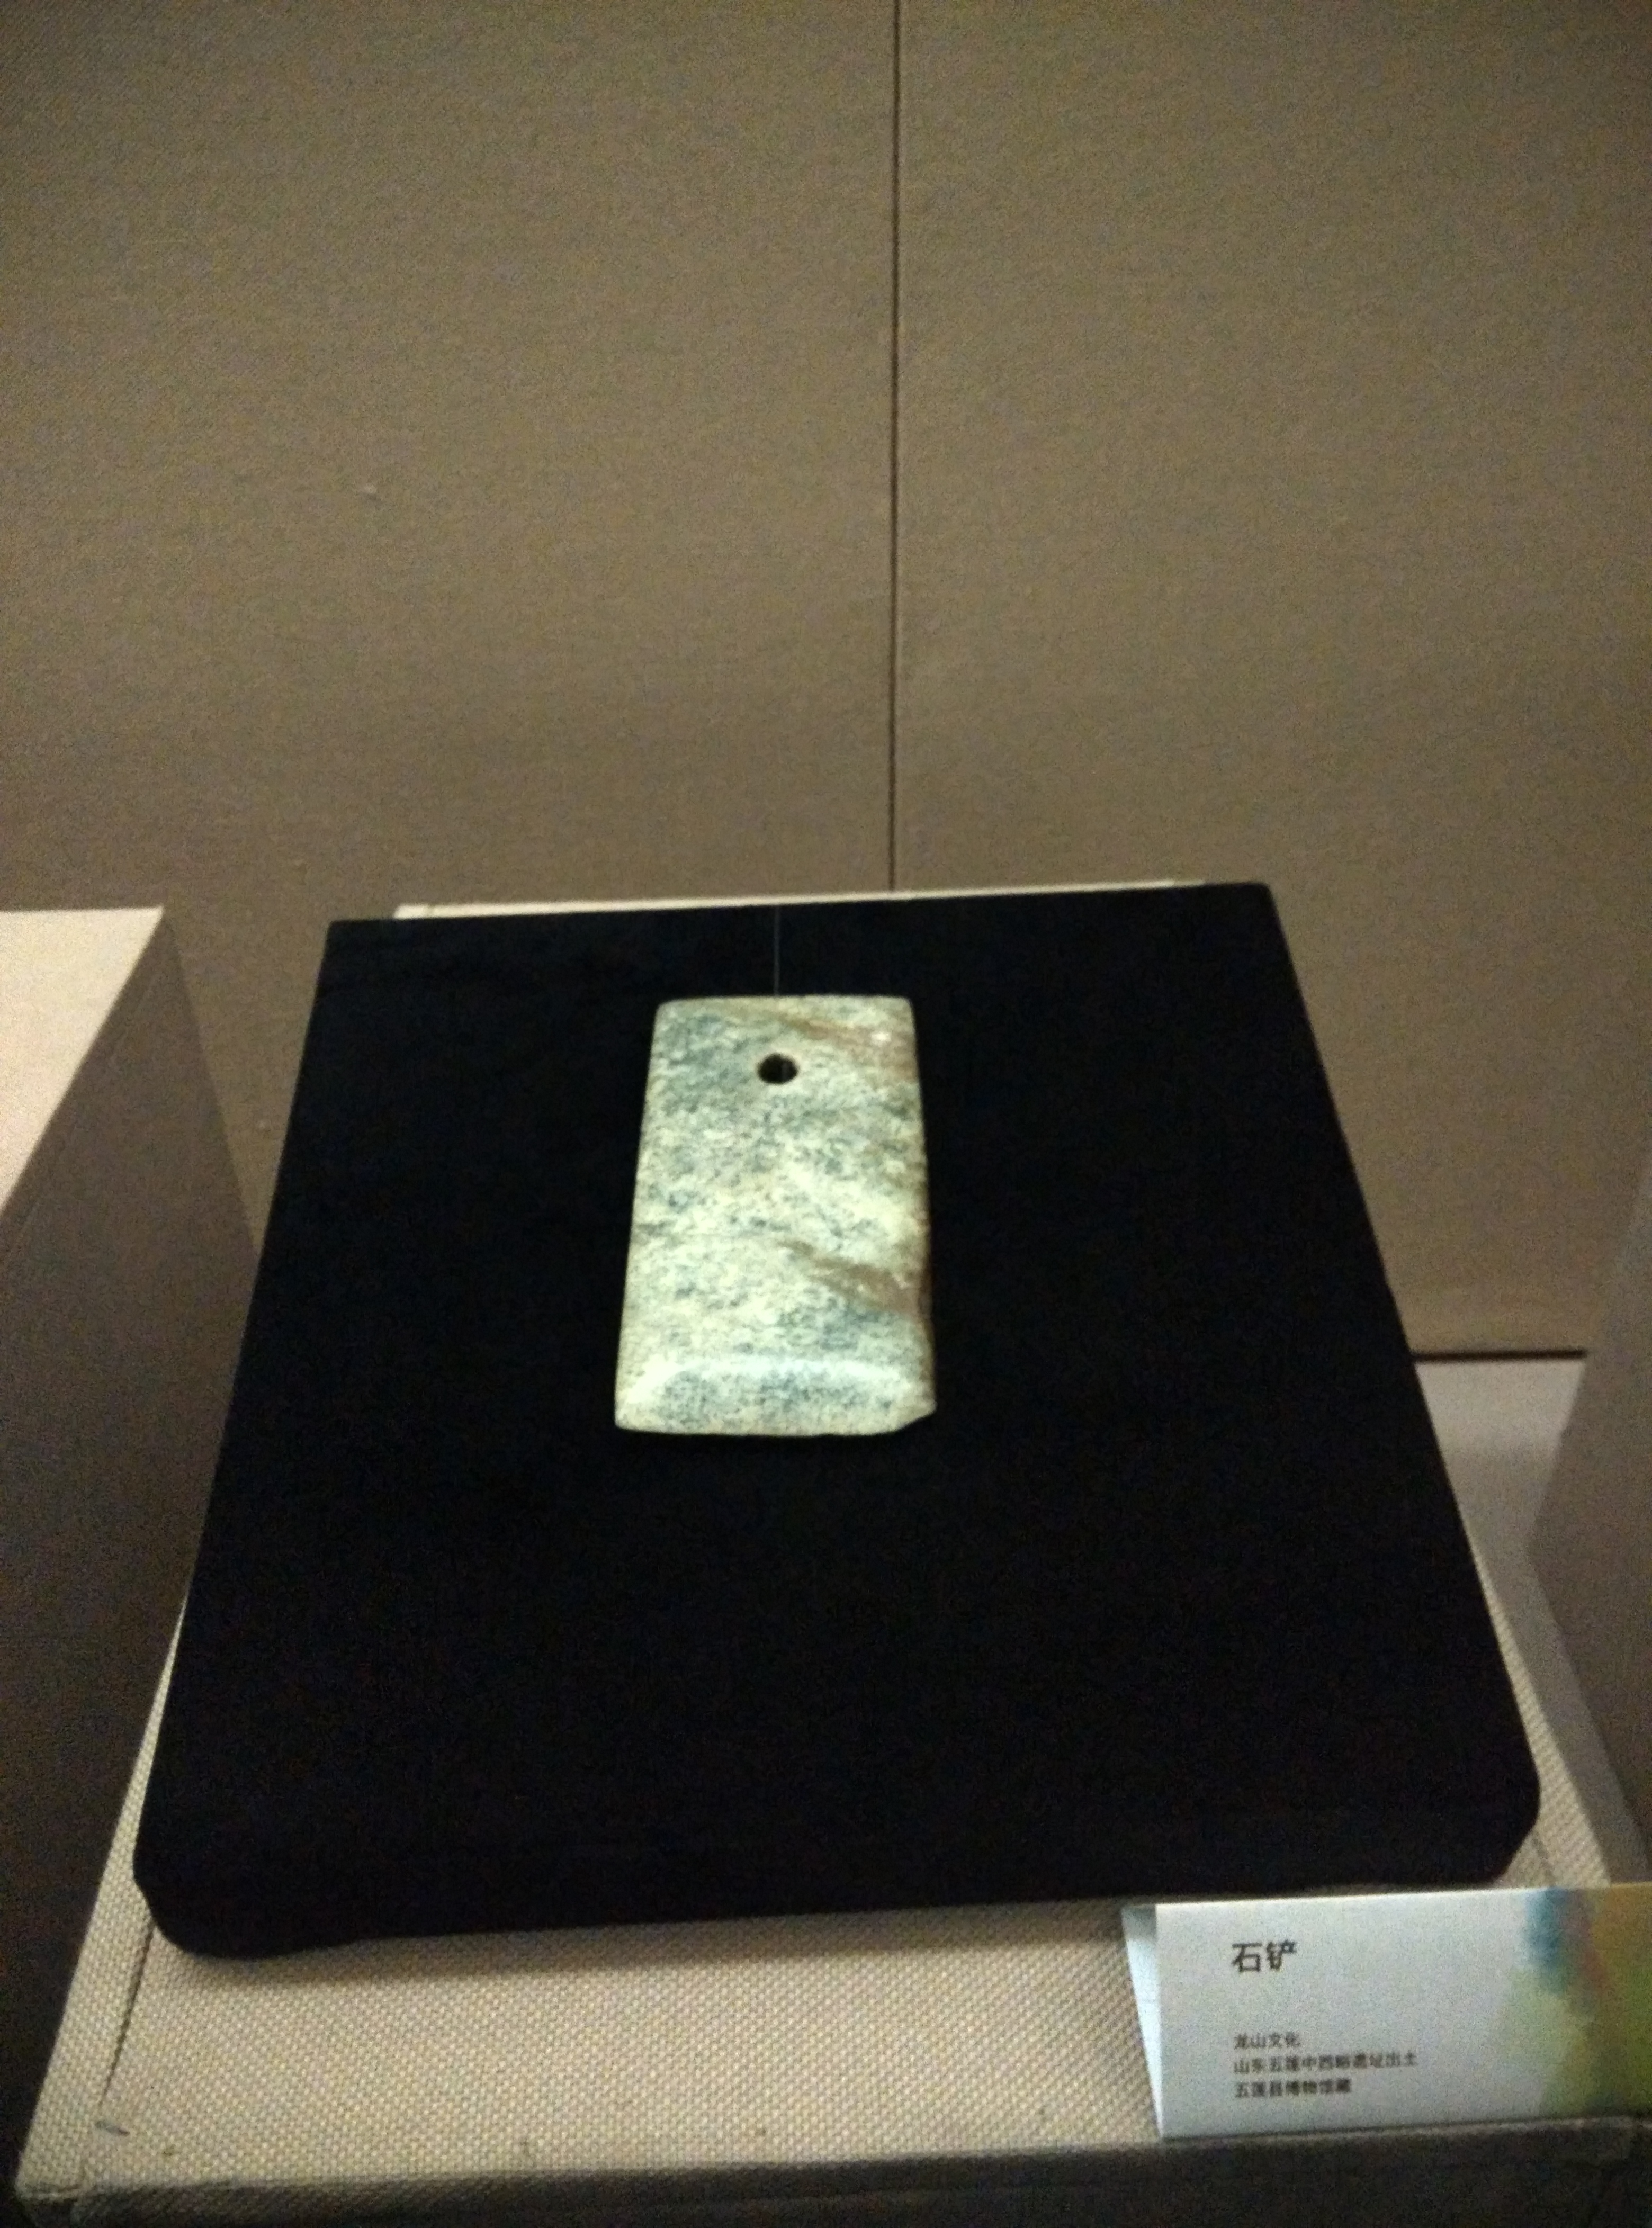
23/5/2015 – Trip to Liang Zhu Museum
We visited the Museum where we got to know more about the Neolithic Liangzhu Culture.


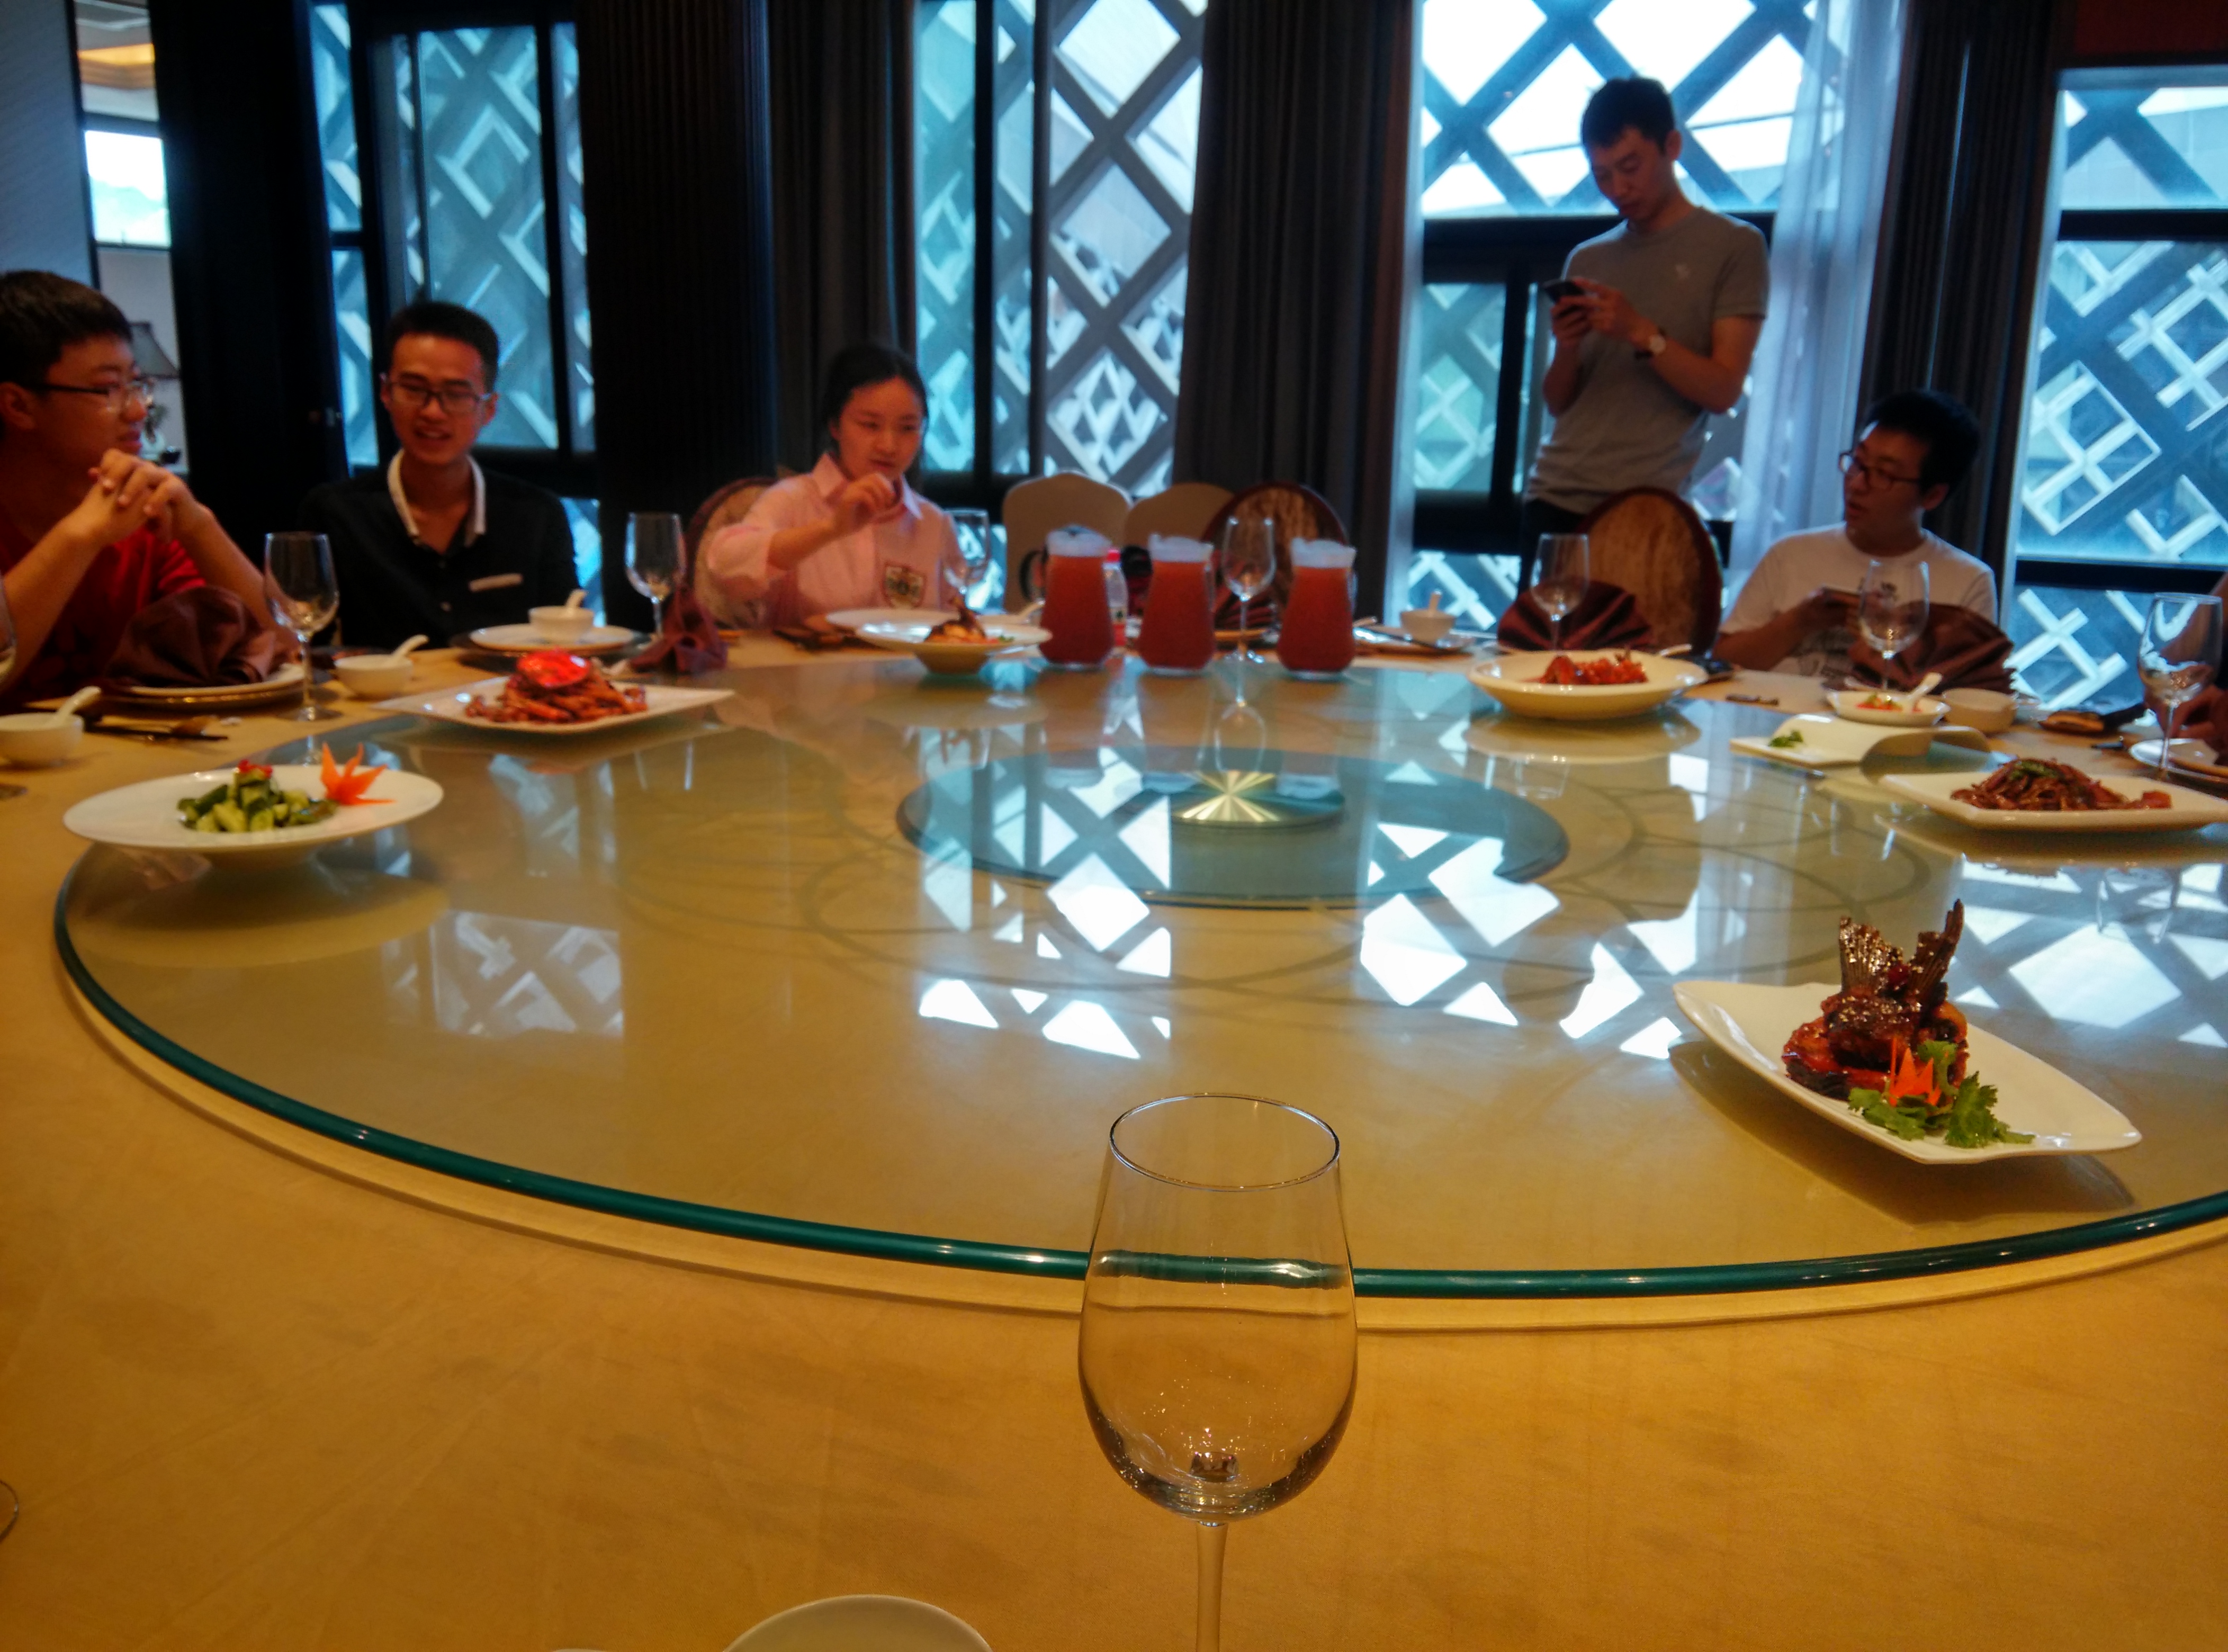
After our visit, our professor brought us for lunch at a nearby restaurant. We had fun interacting while waiting for our dishes, allowing us to know one another better.
Through this visit, we learnt about the different ways data could be experienced(Sight, Smell, Touch, Taste, Ears) especially through physical elements. One such example is that they used a projector and by projecting it at a certain angle, it created an illusion of rain droplets falling down.
11/07/2015 – Visit to the Stock Data Provider Company(同花顺)
Our professors arranged for a visit to 同花顺. Unfortunately, just two days before, it was forecasted that a typhoon (Chan-hom) was approaching. We were unsure if the visit was still on as the path the typhoon was heading was said to arrive in the morning of our visit. Thankfully the weather was fine allowing us to head off!

This visit allowed us to understand the important data that people look out for while playing stocks. We then brainstormed about how we would try to display this information in a more impactful yet simple way.
Area of Focus
We have been split into 3 groups, each focusing on a different element.(Water, Smoke, Foam)
Water
We decided to make use of the physical phenomenon, known as “Levitating Water”. Water droplets can be made to seen flowing downwards, levitate in the air, or even flow upwards, defying the laws of physics. This is made possible due to how fast a human eye can see.
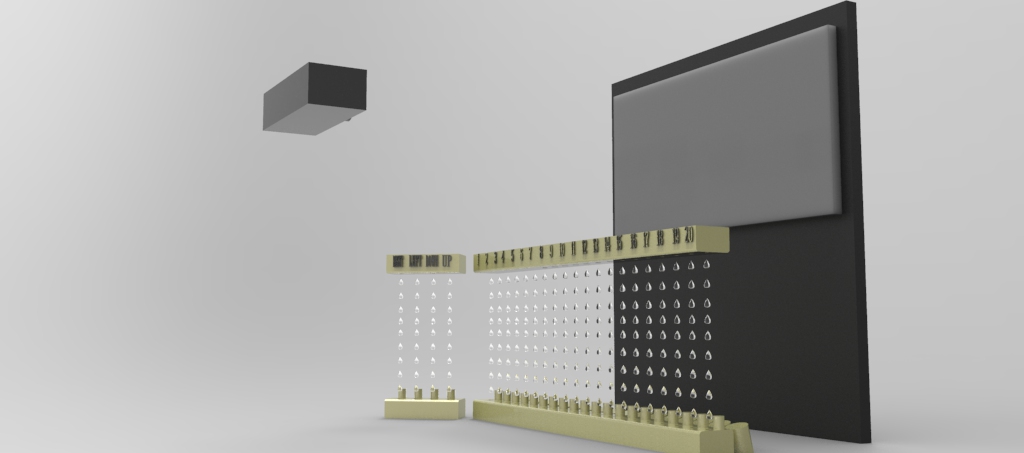
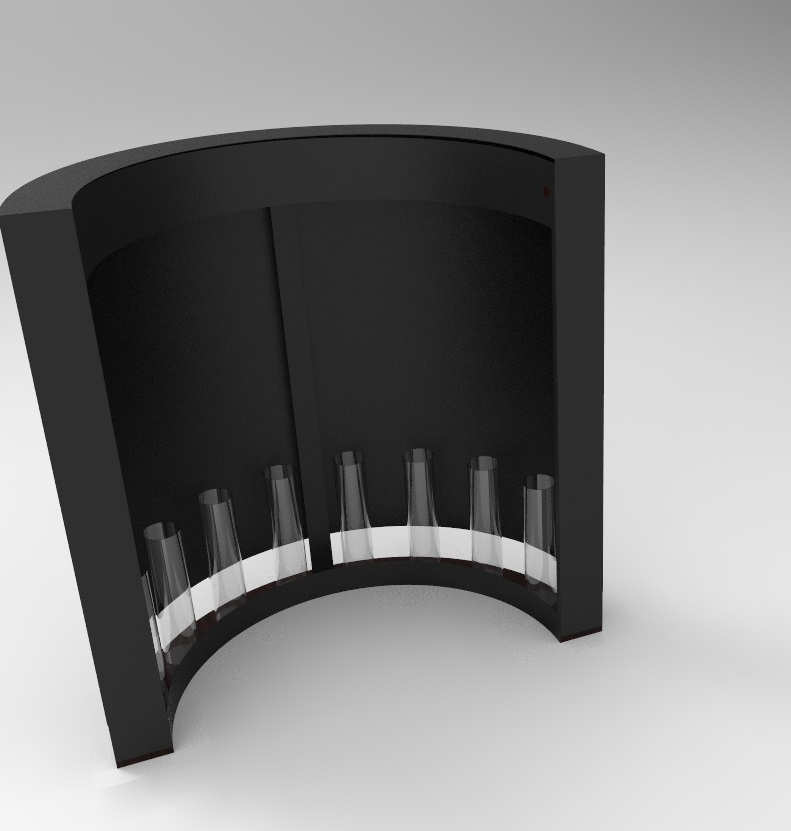
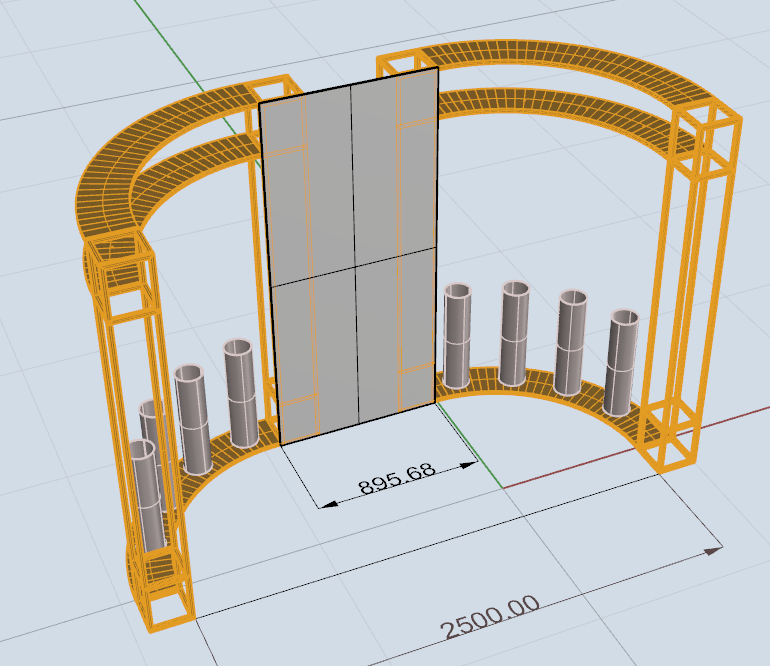
We plan to have 8 streams of water droplets, whereby the colour of the streams would indicate the health of the stock. If the stock’s price were to rise, the water droplets will levitate upwards. The speed of the droplets rising and falling would also indicate how huge the spike of the stock’s price was. Sounds of calm wind or thunderstorms would also be played according the general health of the stocks.
Principle – During the short time span whereby the strobe light was “off”, the oncoming water droplet replaced the water droplet that was seen previously, where the strobe light turns “on” again. Our brain then attempts to fill in the gaps between flashes with its anticipated motion, creating the levitating effect.
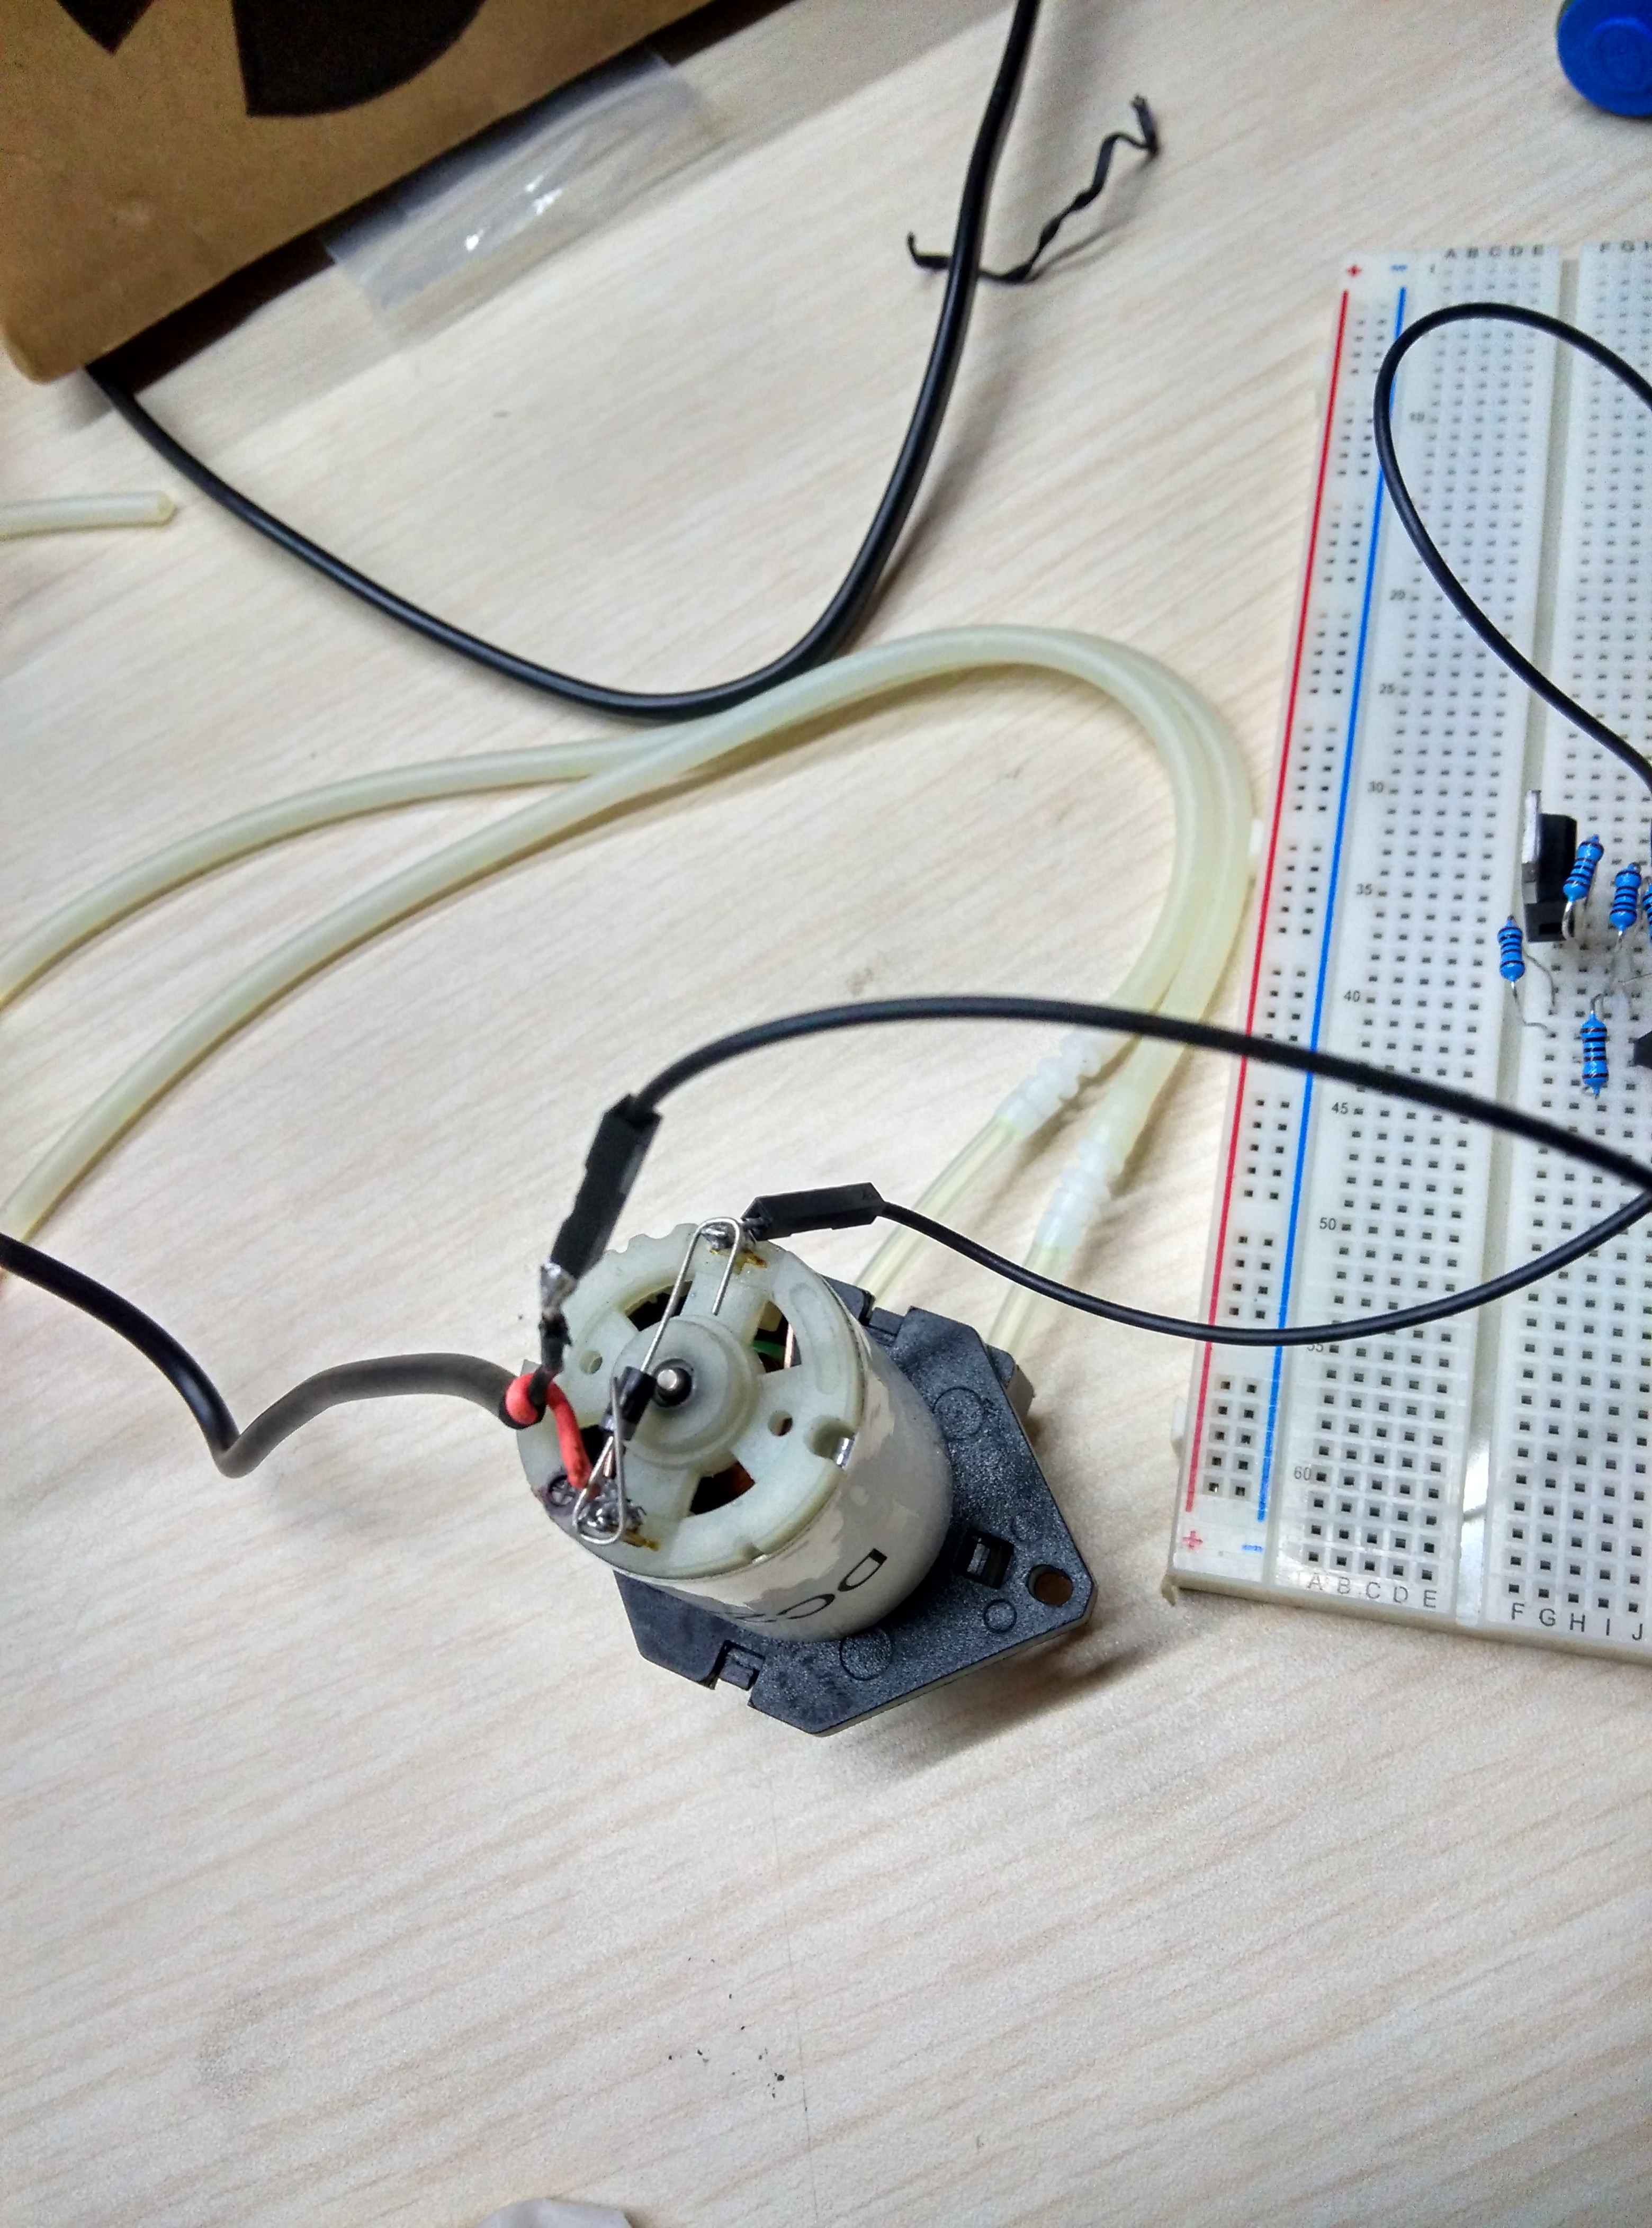

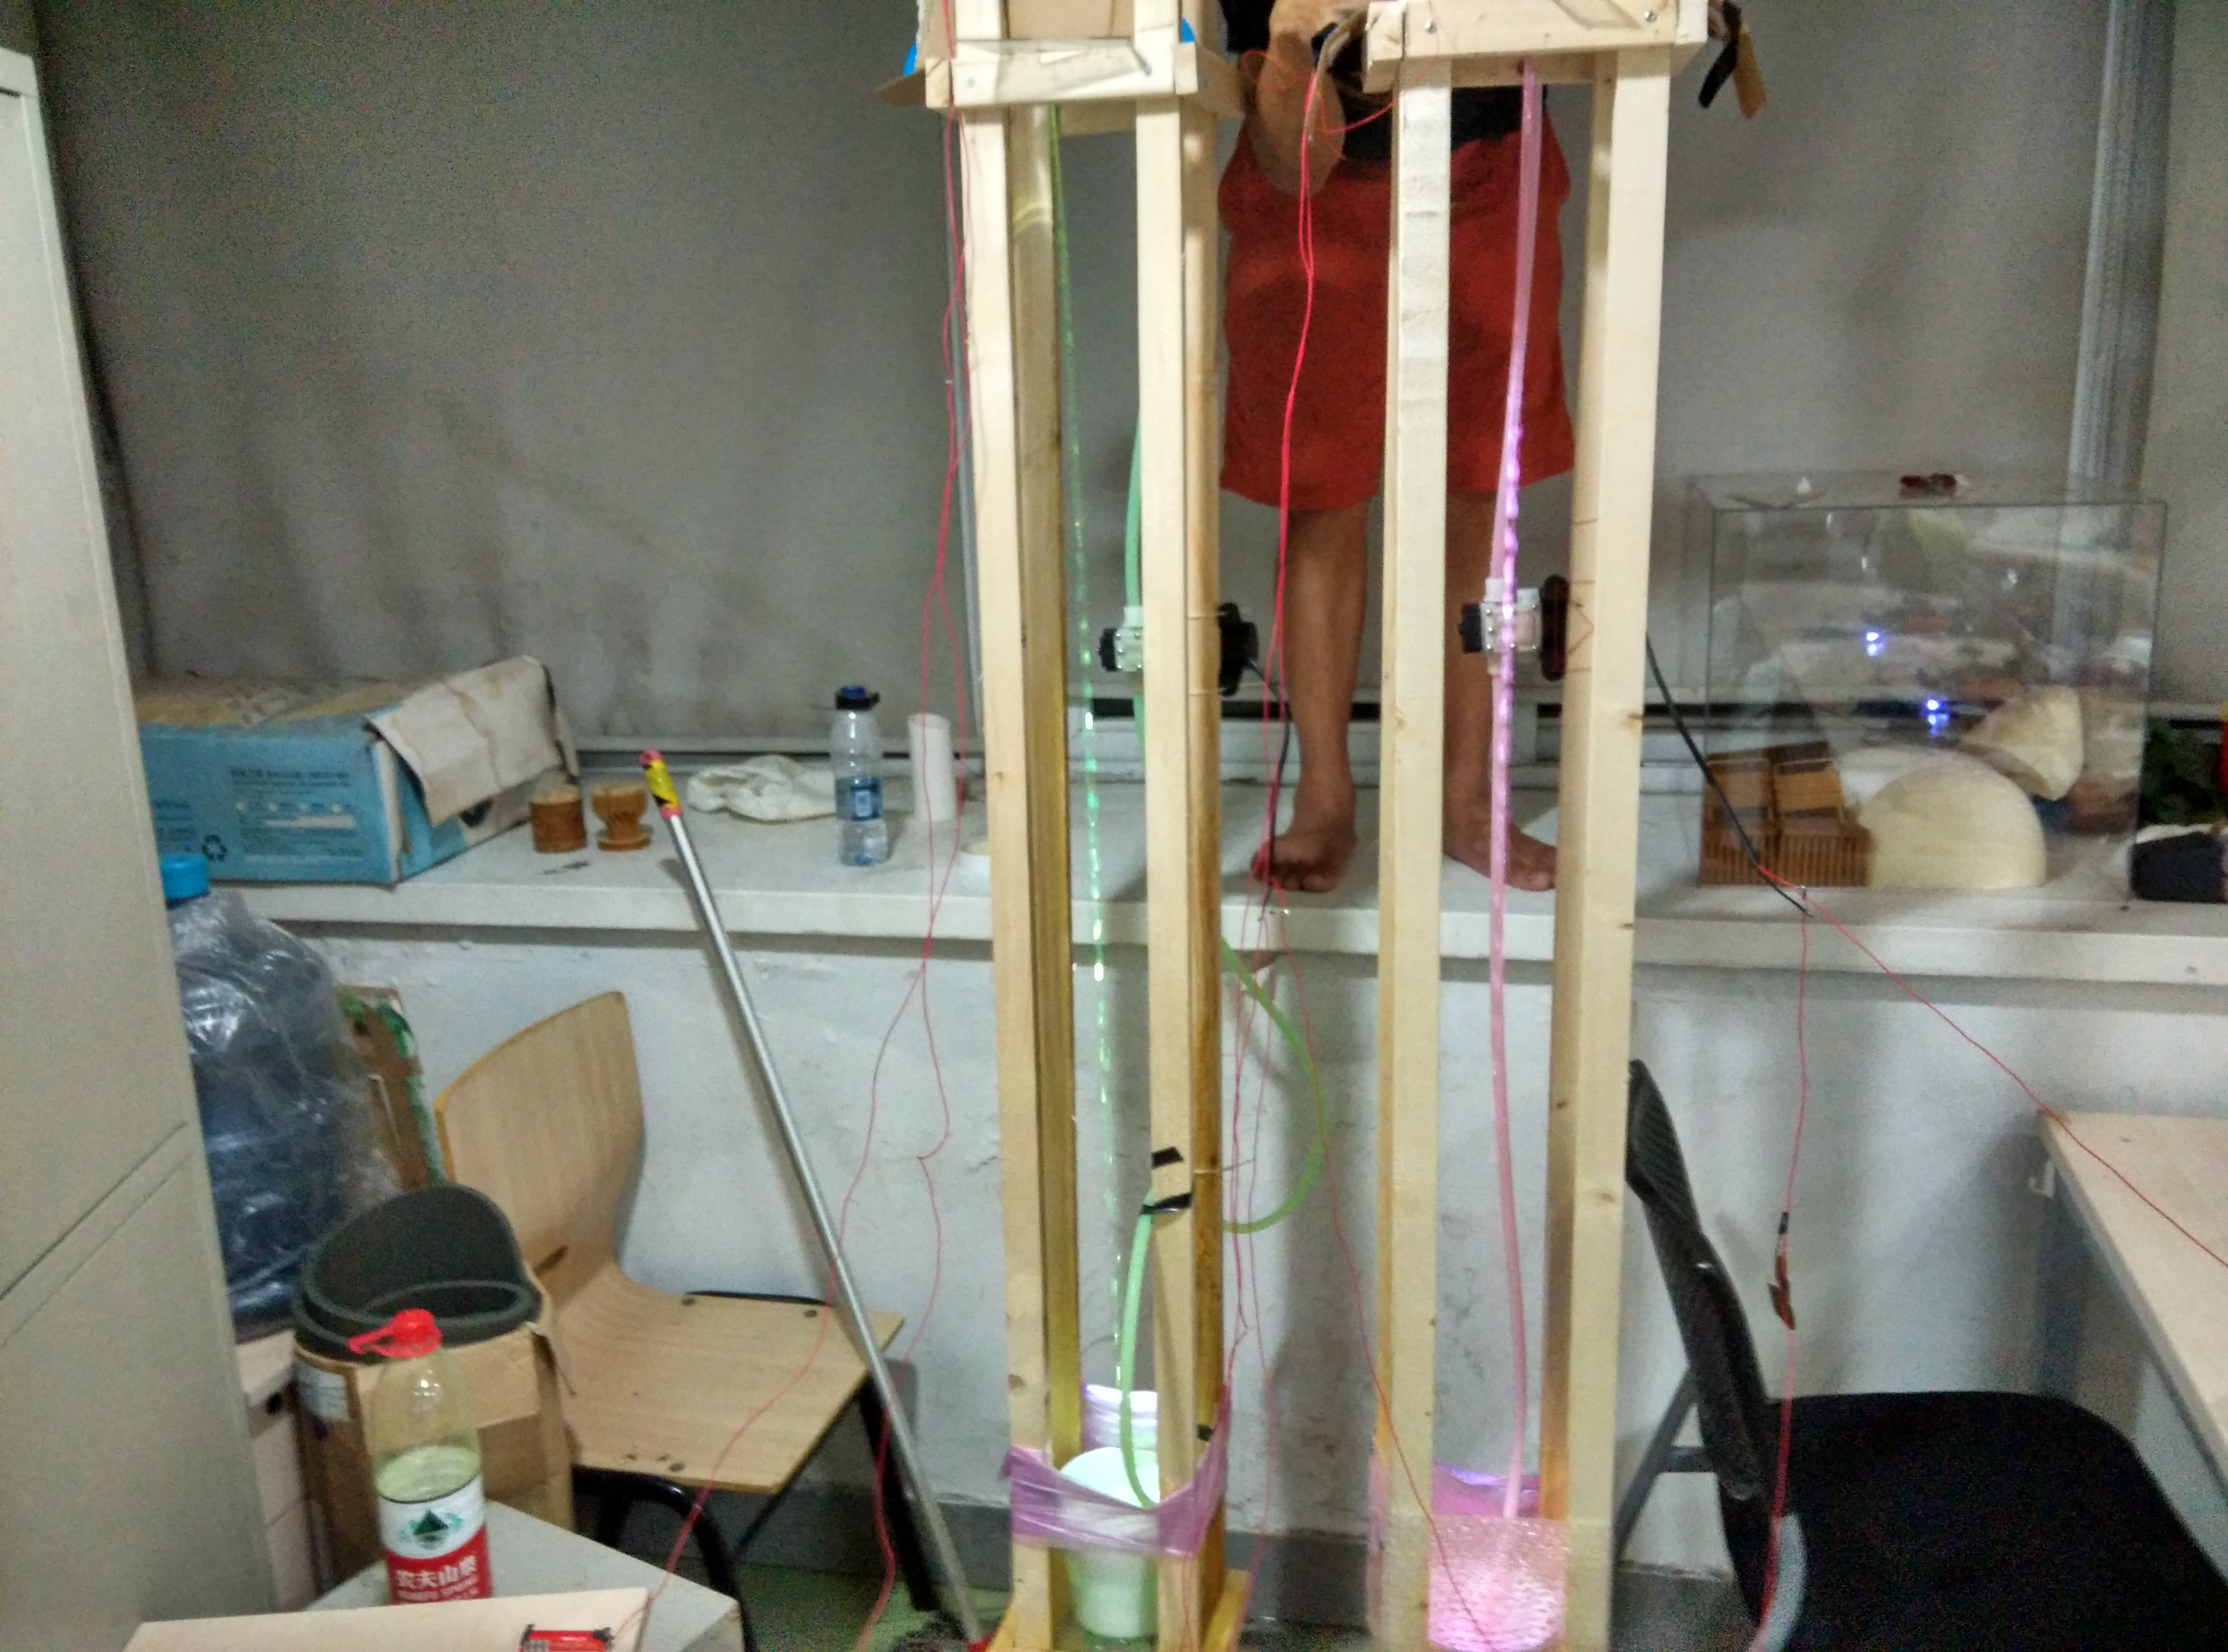

As many of us had little knowledge about electronics or arduino, we had to spent a huge amount of time researching. After burning several transistors, we finally managed to create the levitating water effect!
Currently we are building our large scale prototype and we will come back with more soon!
Smoke, Foam – coming soon!
By Ryan


