


")


This week, after several rounds of discussion, we have basically settle on the topic and layout of our project. So it is the time to start our new journey.
First step is to learn more about coding of data visualization. We atteneded data visualization summer school to make our knowledge more systematical.
The space of coding teaching is really fast here, and it just provides a basic structure, we need to learn more content by ourselves. It is different from Digtal Word taught in SUTD. But it reminds me of the importance of self-learning. It’s an ability we should master during our whole student life and work.
Second, we strat to try to code a web page. After downloading lots of softwares and keying in words, we eventually figured out where should we write the code and how to run it. Our TA patiently explained to us how we should play with these softwares. We finished some small tasks first. For instance, changing color of a bar chart. Here is a screenshot of my result.
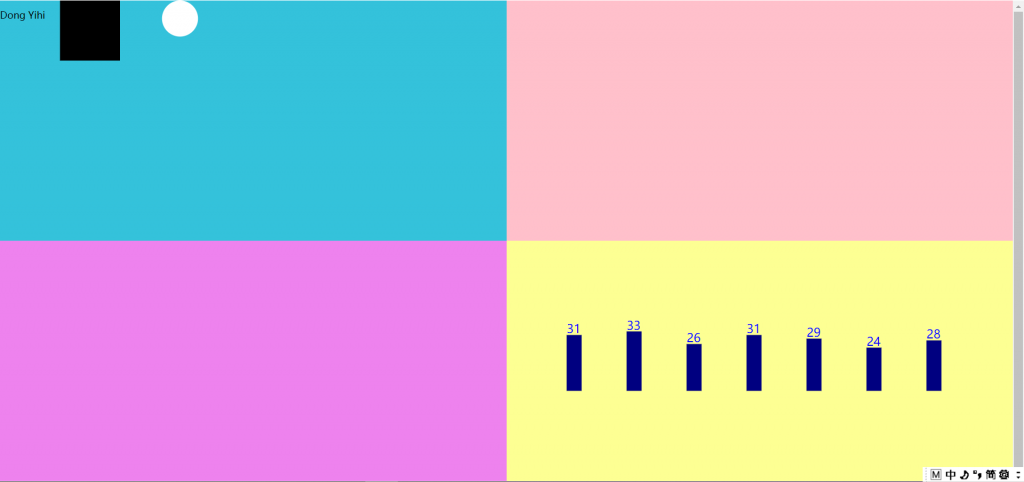
Although it is simple and lacks some functionality, it is a good practice. And after this we are able to explore more. I think data visualization is quite a good skill for ESD students, we can realize dynamic data visualization effects and acquire knowledge of efficient ways of presenting data.
This week is the last week of design fiction and all the courses as well. The deadline will be in next week. Wish we all get good results.


